Sun Valley: Denver’s Future EcoDistrict
With a population of over 5 million in Denver’s wider metropolitan area, Sun Valley is set to become the city’s first EcoDistrict. Sun Valley is a small, low density, low income, central Denver district of just over 1,500 residents. It is located west of Interstate 25 and south of Sloan’s Lake Park. The redevelopment plan will more than double the number of available housing units, from 333 to 750, and the EcoDistrict will include a 30,000-square-foot, multi-use public space. This community facility will consist of offices, community engagement space, an art gallery, food services, and a resource library for Sun Valley residents. The district is 94% subsidized by the Denver Housing Authority (DHA), providing the perfect opportunity for Denver to follow the EcoDistrict model, a certification that requires a collaborative, holistic, neighborhood-scale approach to community design to support people and planet.
With development plans taking full shape, in true EcoDistrict style, the project team is especially focused on measuring and monitoring the redevelopment’s environmental footprint—from the intensity of resource consumption during construction, to energy and water efficiencies, to waste disposal facilities that are designed to minimize the district’s environmental impact throughout its lifetime. One metric that all aspects of the redevelopment from cradle to grave have in common is greenhouse gas emissions.
Carbon as a Metric of Environmental Impact
This is where carbon metrics come into play. Greenhouse gas emissions, embodied in the production of all products and services, can be measured and quantified as carbon dioxide equivalent (CO2e). Carbon is stored in urban soils, trees, and other plant biomass. Carbon is also generated by human activity, particularly fossil fuel combustion for transportation and electricity production, but also during the processing of construction materials and the manufacturing of construction equipment.
Why are carbon metrics important?
In the case of Sun Valley, determining a baseline carbon footprint is critical in order to fully understand the environmental impact of the redevelopment’s increased energy efficiencies. The building sector is responsible for 39% of all emissions in the United States, including construction-related emissions as well as emissions from residential and non-residential sources. Modeling the carbon footprint early in the planning stages provides the opportunity to identify processes that the project team can adjust or enhance to support greenhouse gas mitigation, decreasing the redevelopment’s overall carbon impact.
As an IBE fellow, I am using GIS methods to estimate carbon stored in the soil and in tree biomass of Sun Valley district as it is today. Further, I will be looking at current data on Sun Valley’s electricity, natural gas, and water consumption to see how this compares with projected efficiencies of the planned buildings. The last step of this research will be completing a life cycle assessment for the community building, which will give an idea of the extent of CO2e that will be emitted in the building’s construction and decommission process. This analysis will generate a carbon baseline, against which the project team can compare carbon changes throughout redevelopment to make proactive decisions.
 Embodied Carbon: Emissions Throughout the Production Process
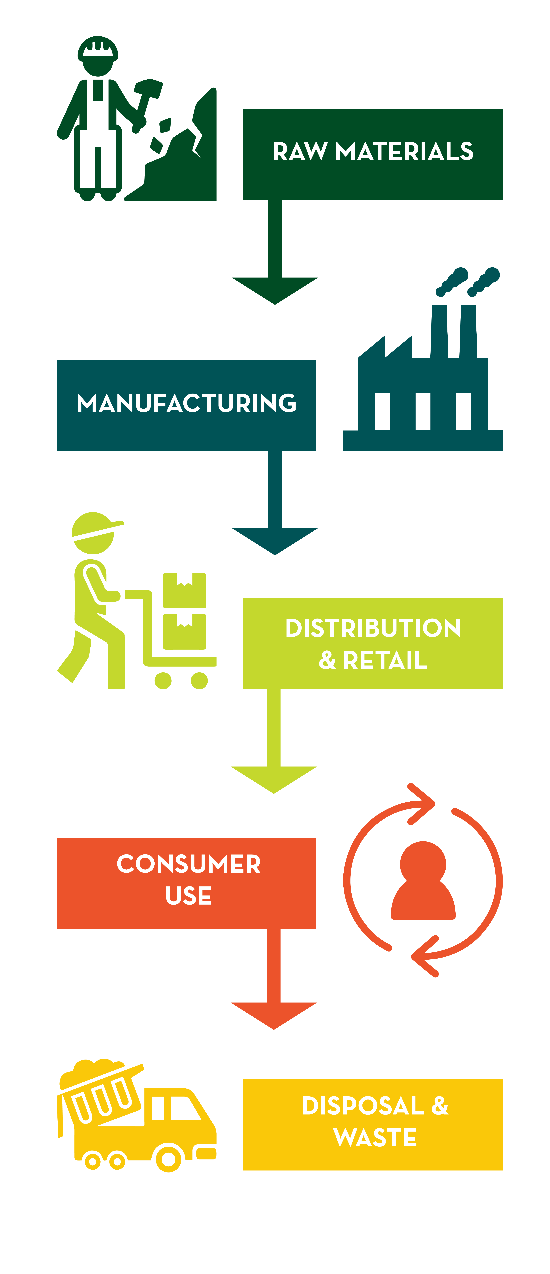
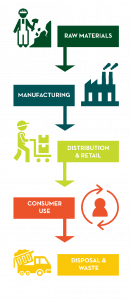
The five stages of any product’s life are: raw materials, manufacturing, distribution and retail, consumer use, and lastly, disposal and waste. The amount of carbon embodied in a product or service can be determined by a life cycle assessment, which in this context totals greenhouse gas emissions generated from the product’s cradle to its grave. This is an important concept in the measurement of construction- and energy-related emissions for the future Sun Valley EcoDistrict.
Emission Offsets: Energy Efficiencies & Natural Carbon Sequestration
Emission savings can be achieved through energy efficiency strategies and/or through enhanced natural carbon sequestration. Trees and other plants fix carbon through photosynthesis: though much of this is respired back to the atmosphere, a portion of it is converted to sugars and stored as plant biomass. Soil microorganisms also fix carbon through photosynthesis, retaining some carbon in the soil. These are both processes of natural carbon sequestration.
In the Sun Valley planning process, the team is considering the relative effectiveness of various strategies in reducing carbon emissions. In indoor urban environments, the greatest emissions savings are achieved through reductions in electricity and, to some degree, water consumption. Further, increases in public transportation or alternative transportation, such as walking and biking, can significantly impact the amount of emissions.
In outdoor urban environments, the greatest potential to offset emissions is through planting trees and ensuring healthy soil conditions. Young and old trees sequester carbon at lower rates than middle-aged trees, because young trees do not yet have the biomass to photosynthesize and grow at their fastest rate, and older trees have a slower growth rate. Put simply, middle-aged trees are the greatest environmental mediators when it comes to greenhouse gas emissions.
The Science Behind the GIS Analysis
In my research, I am calculating soil carbon down to 100 centimeters depth, and calculating tree carbon based on the species and ages of Sun Valley’s existing tree cover.
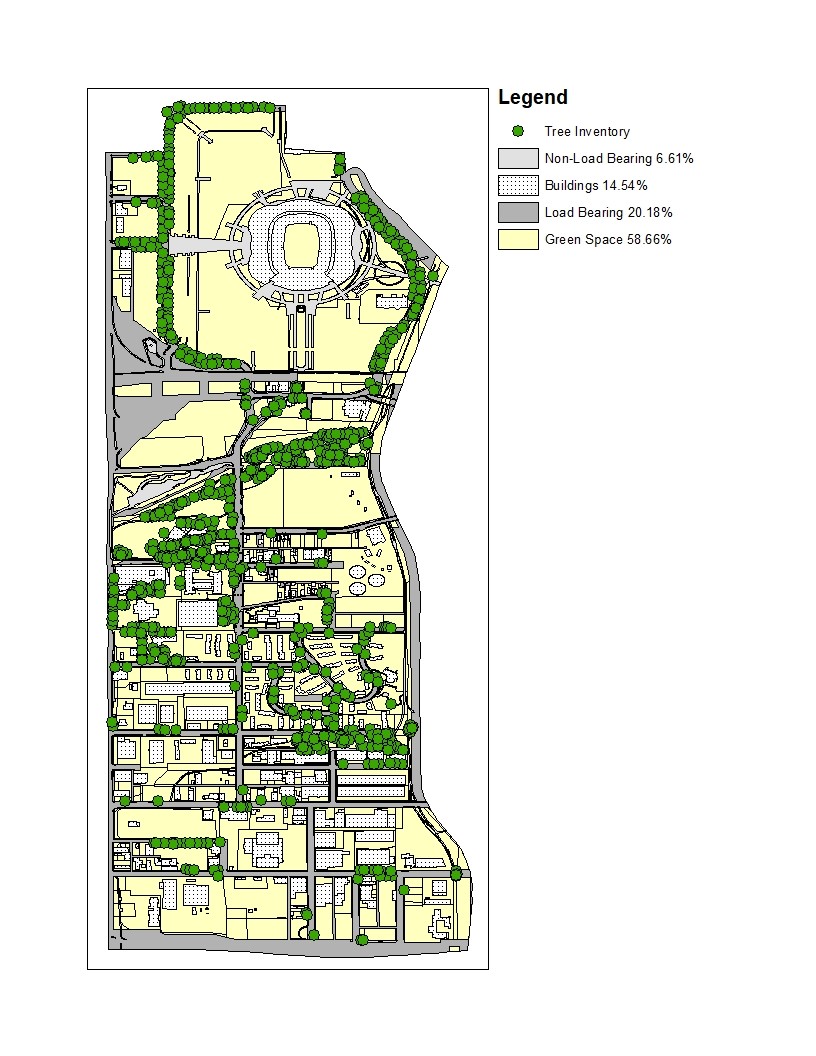
Soil Carbon: Urban environments have many different surface types. For the sake of soil carbon classification in this analysis, Sun Valley’s surface can be separated into impervious surfaces and green spaces. Impervious surfaces can be further classified as: i) load bearing surfaces such as roads and driveways, ii) non-load bearing surfaces such as sidewalks, and iii) buildings. Carbon analysts apply estimates of the amount of carbon per square meter of each type of impervious surface. These estimates are either based on scientific peer-reviewed literature for an applicable climate and study, or on real data collected for the research; the method depends on the research budget. For example, with a mean excavation depth of 40 centimeters, the construction of load bearing surfaces cause greater soil carbon disturbance than non-load bearing surfaces, which are typically excavated to only 15 centimeters. A safe assumption of carbon analysts is that because buildings have deep foundations, all organic carbon is removed or lost during their construction. To determine the total amount of carbon stored in the Sun Valley soil sink, the area of each of these four surface types (load bearing, non-load bearing, green spaces, and buildings) is multiplied by their respective expected amounts of carbon per square meter.
Tree carbon: To determine the total carbon stored in tree biomass, I am calculating the total volume of trees and their roots with allometric equations and then multiplying this by 0.5 as a correction for the tree’s water weight to derive the portion of biomass that is pure carbon. This stage of GIS analysis has not yet been completed, but the following image shows surface coverage and gives an idea of how this type of analysis can be used to provide real carbon metrics that can then be used to manage greenhouse gas emissions at the district scale.

Next Steps: Today’s Sun Valley vs. Tomorrow’s EcoDistrict
The next stages of carbon metric development, as mentioned, will include a life cycle assessment (LCA) for one of the planned residential buildings and for the community multi-use space facility. These CO2e values will incorporate the built environment’s embodied emissions and ongoing annual greenhouse gas emissions. This, combined with the amount of carbon being sequestered (drawn down) annually through tree photosynthesis, will provide a clear metric for the environmental impact in terms of greenhouse gas emissions for the future SVED.
Like many cities around the world, Denver has an ambitious climate action plan. Many cities, including New York and Boston, have also completed comprehensive carbon budgets to understand their environmental impact, and to identify areas where greenhouse gas emissions can be reduced. Yet there remains a ripe opportunity—and an urgent need—to take similar action at the district level, and this is a key area for growth if we are to meet the global climate challenge. Sun Valley EcoDistrict could be one of the first districts in the world to fully account for its greenhouse gas emissions, providing inspiration for other districts to take responsibility for a district-level approach to tackling climate impact.